Ever wondered why those so-called helpful articles online never seem to solve your memory leak issues? Well, here's the deal: those articles are just all about showing off some basic examples, like a simple loop with a million class insertions in just 10 lines of code.
But let me tell you, real-life code is way more complex than that. When you're dealing with an actual codebase that's been around for years, finding memory leaks becomes a real nightmare. You have no clue where to even begin!
So, step one is obviously to take a snapshot of the situation. You go ahead and do that, and guess what? The snapshot ends up looking something like this:
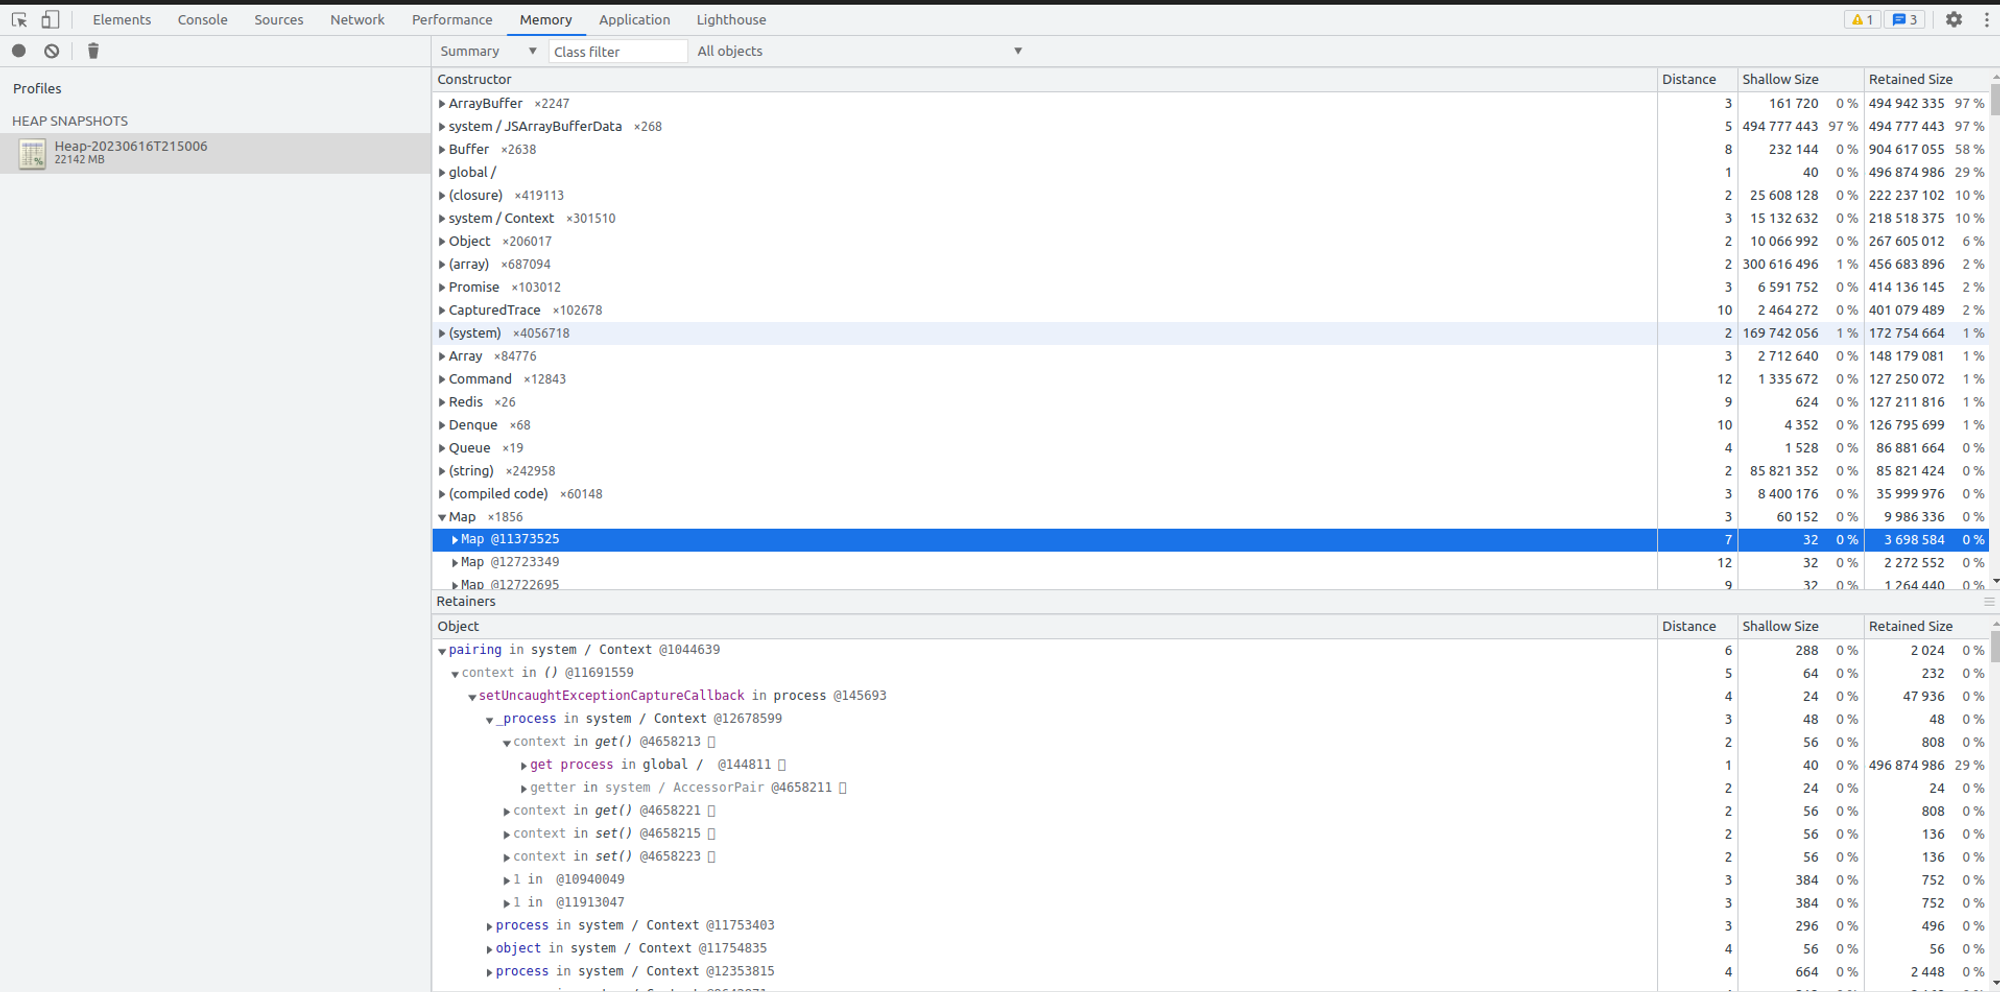
And that's when you realize that solving memory leaks ain't as straightforward as those articles make it seem. It's a whole different ball game, my friend.
Alright, let's agree that this snapshot doesn't offer much help in pinpointing the memory leaks. It may show us how memory is distributed, but it's far from leading us in the right direction.
However, don't dismiss those seemingly unhelpful tool just yet. They can actually point you in the right direction when it comes to identifying memory leaks. The key is to find a better tool that can make sense of all the data.
Alright, so the first step is to generate the heapshot. But how do you do that? Well, in the Node.js ecosystem, there are several libraries that can help you with that. You've got options like node-memwatch, headpdump, and nleaks. So, start by choosing one of these libraries and generate your heapshot.
Now that you have your heapshot, it's time to dive into the fantastic tool called memlab by Facebook. Memlab offers a bunch of amazing utilities that you can explore in their documentation, which you can find here: https://facebook.github.io/memlab/
Alright, the two primary tools we need from memlab to help us identify memory leaks are:
memlab find-leaks: This tool is your best bet for finding memory leaks. Give it a shot! You might get lucky and actually find a leak by comparing two snapshots. Here's an example command to compare snapshots:
memlab find-leaks --baseline base.heapsnapshot --target Heap-20230607T193201.heapsnapshot --final Heap-20230607T193201.heapsnapshot
Keep in mind that finding leaks using this tool may not always be straightforward, but it's definitely worth a try.
2. memlab view-snapshot: If the find-leaks tool doesn't serve you well or if you want better visibility into your heapdump, you can dive into the view-snapshot tool. It's similar to the heapdump explorer provided by Chrome, but it offers improved visibility and features.
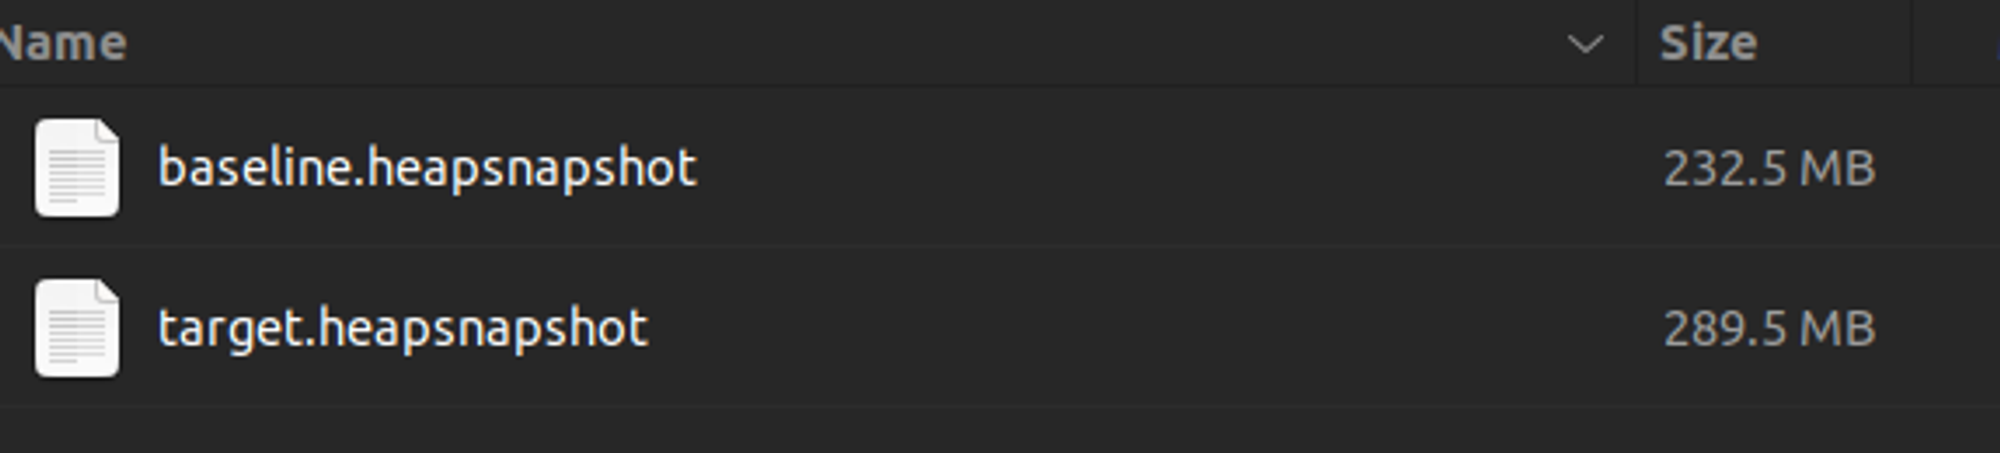
You first take a baseline snapshot, which means a snapshot earlier in your application timeline, and view the snapshot using : memlab view-heap --snapshot baseline.heapsnapshot
The resulting data from viewing the heap snapshot using memlab would provide you with insights into the memory allocation and usage in your application
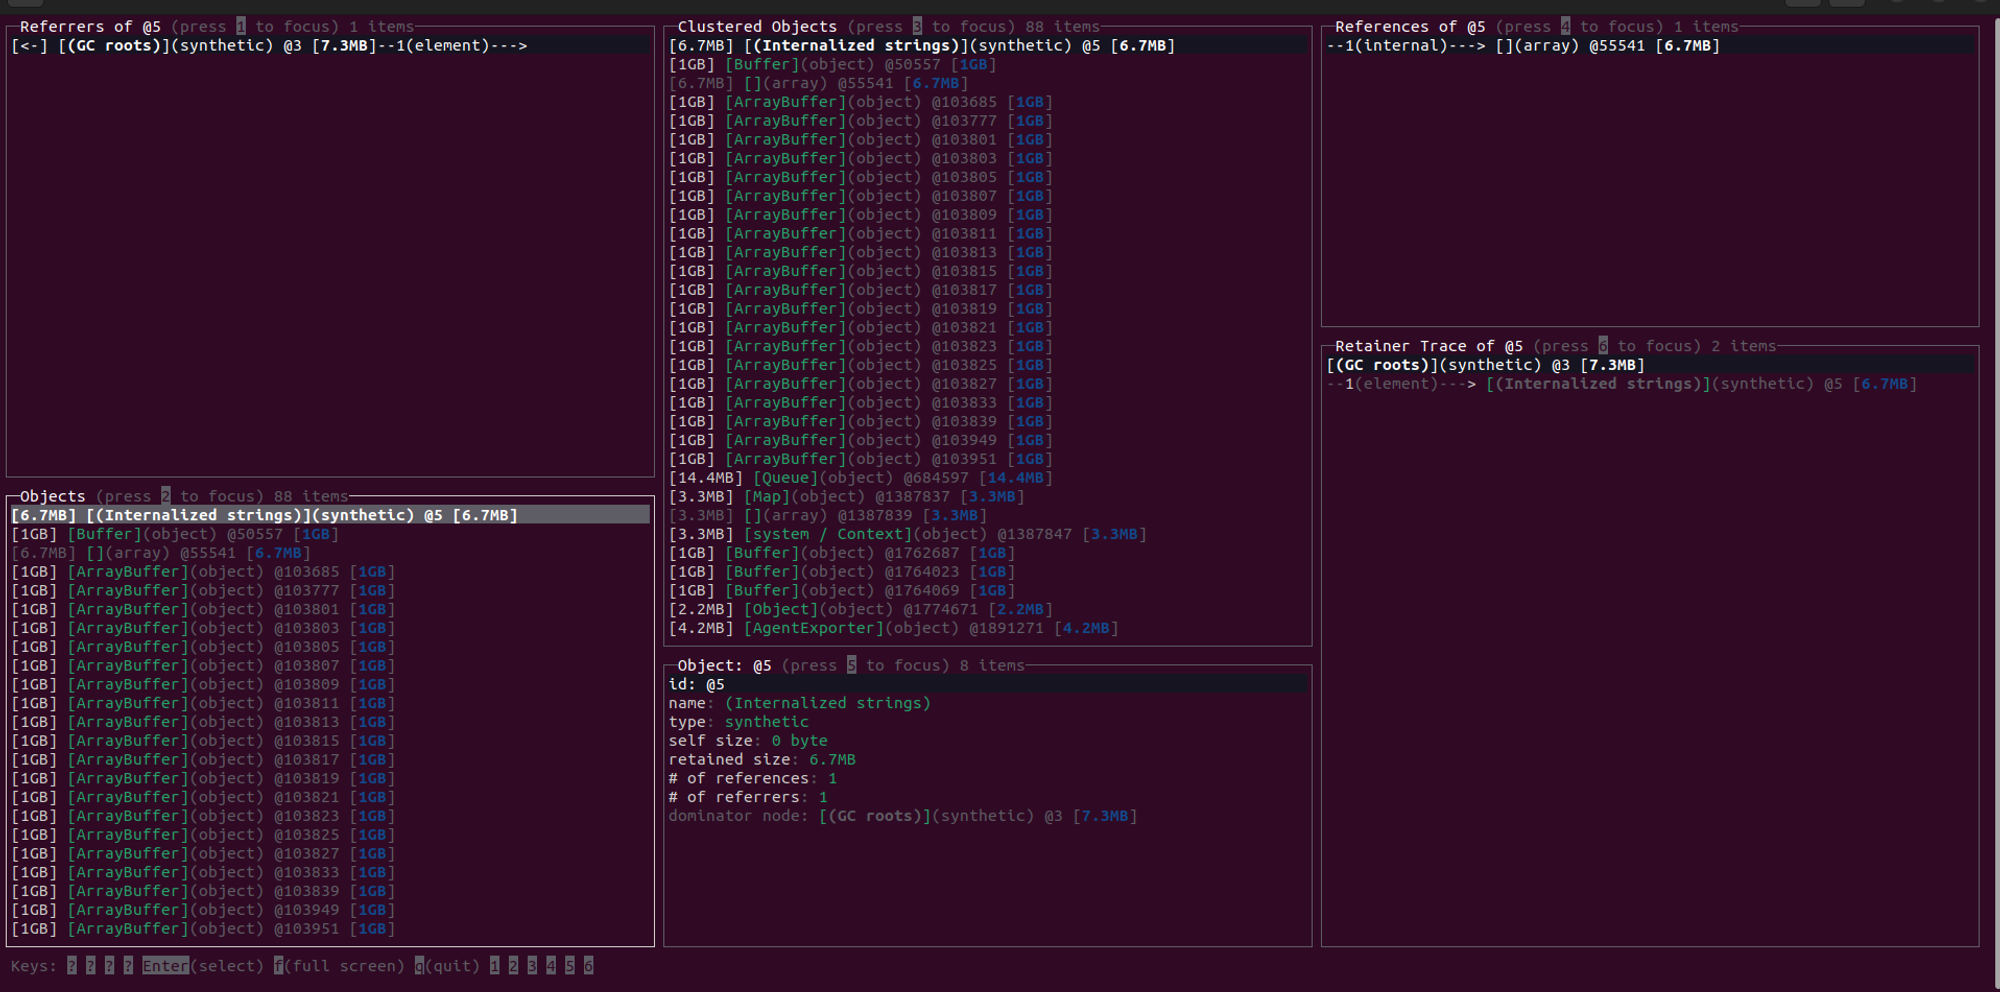
Direct your attention to panel number 2: Begin by focusing on panel number 2, which contains the relevant information and details about the objects in the heap snapshot

Once a sufficient amount of time has passed, and you become aware that the memory has significantly increased, capture another snapshot. Compare the sizes of both snapshots to determine the difference.
Next, compare the two snapshots side by side using the Memlab Snapshot Explorer. Look for any new entries in the explorer that are occupying a significant amount of memory. Wow!!! We find a very intresting object which grew 67mb.

Now, let's capture another snapshot after the memory has grown considerably larger. Once again, compare the two snapshots and carefully examine the recent snapshot for any changes in the size of objects or the presence of newly added objects.
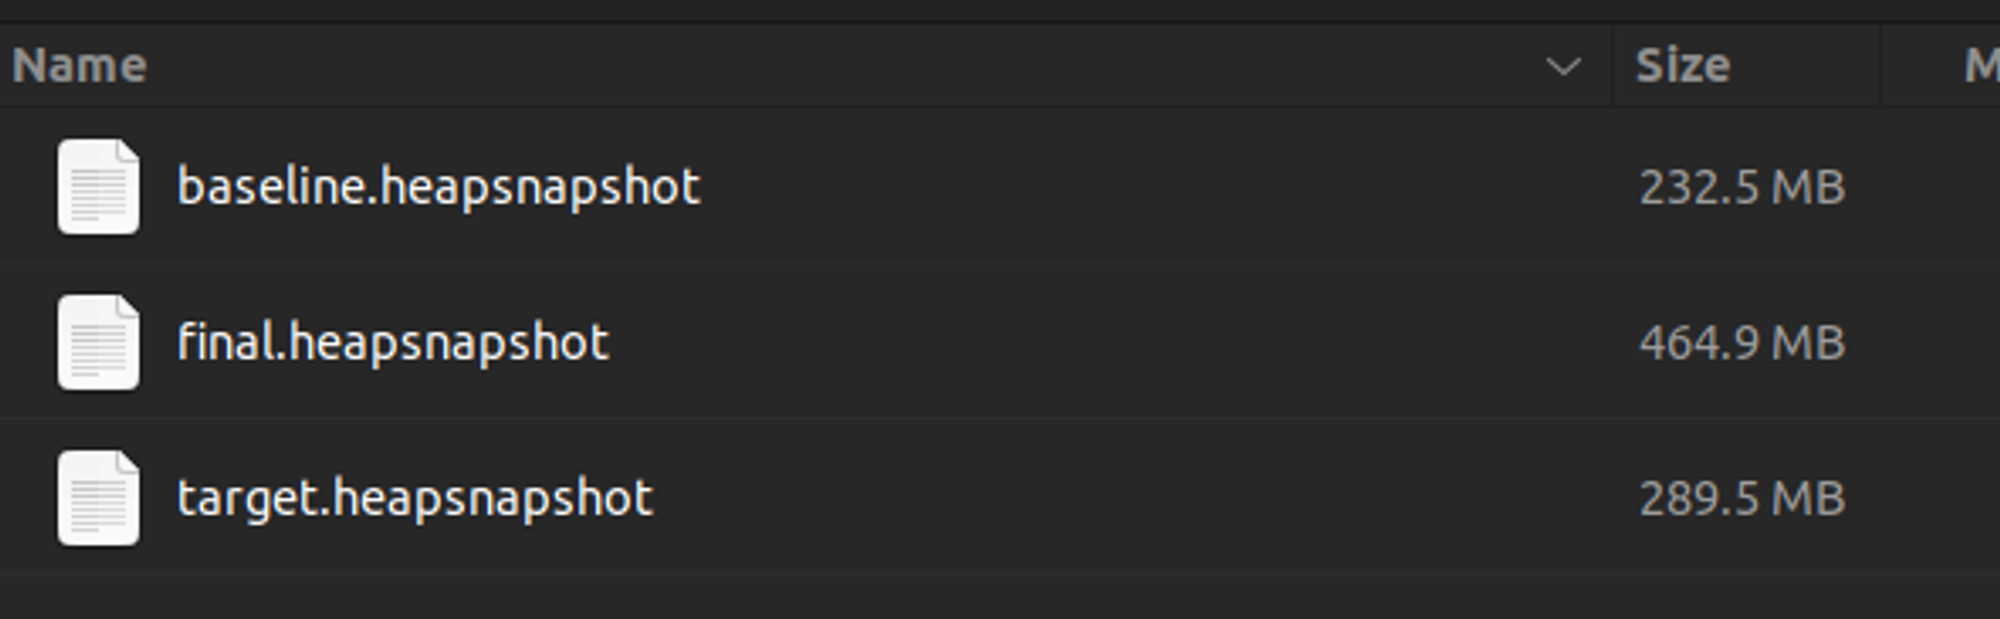
In the final snapshot, it is observed that the memory has grown and doubled. Let's proceed to view the final heapshot in the explorer and analyze what specifically has increased in size.
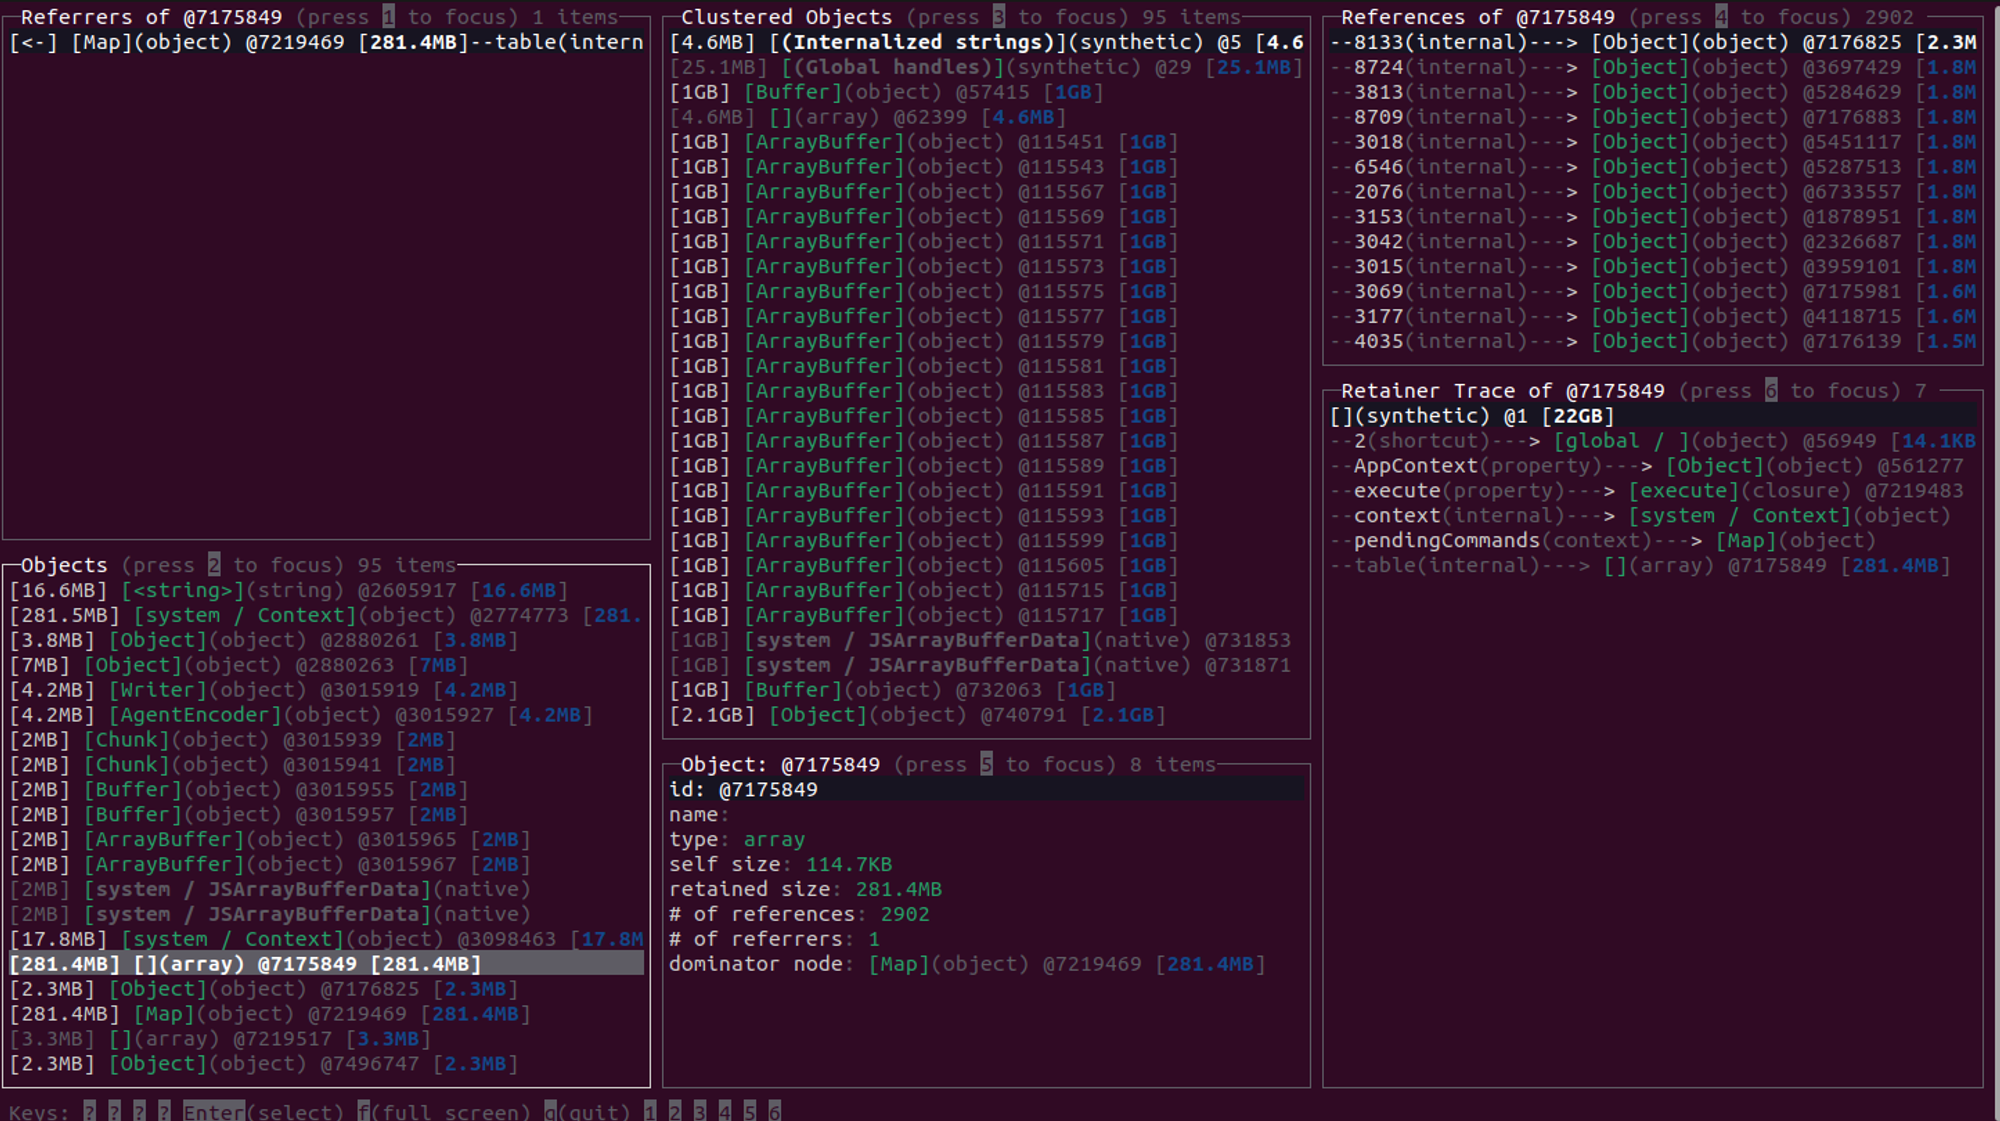
That's interesting to note. It appears that the same object has grown significantly to 281MB, indicating a potential memory leak. I comprehend that every code is unique, but this approach proves to be significantly superior compared to following generic online articles that often provide minimal guidance. So now nexttime when you have a leak in your code, do remember a tool called memlab.