The idea of "logging" is probably one of the most forgotten parts of engineering. Many people don't do it right, and others don't even care about logging.Logging is important and not just a random thing to do for a number of reasons.
First of all, logging is probably the most efficient way to keep an eye on your production setting. Logging becomes your main way to see what's going on behind the scenes, especially if you follow best practises and don't access the production environment directly, which you shouldn't do.
Now, there are several types of information that you may record. You are not just recording a basic one-liner of information; you are also reporting problems and warnings. The problem, however, is that you must first handle these exceptions and warnings in order to correctly log them.
Leaving exceptions and rejections unhandled in your system is a typical mistake, and people often don't realise how important they are. After all, if the system looks like it's working fine, why deal with these error details?
There are numerous compelling reasons to address these issues promptly. However, today, I'm going to highlight a reason that isn't commonly discussed.
Many logging systems charge based on the volume of log lines they process. In a well-organized system, you have the upper hand in determining what gets logged. This control extends to specifying the format and manner in which logging data is streamed.
Here's the tricky part: uncaught exceptions and unhandled rejections, by their very nature, escape your control. They tend to generate extensive stack traces, and logging systems, as you may know, treat each line of these stacks as separate log entries. Do you see the issue here?
And that's why you need to pay close attention, because the lines you log will significantly impact your expenses.
Today, I want to share an interesting engineering challenge I've been working on for the past few weeks. As I mentioned before, it involves dealing with multi-line logs in the DataDog system. The more lines we logged, the more it was costing us.
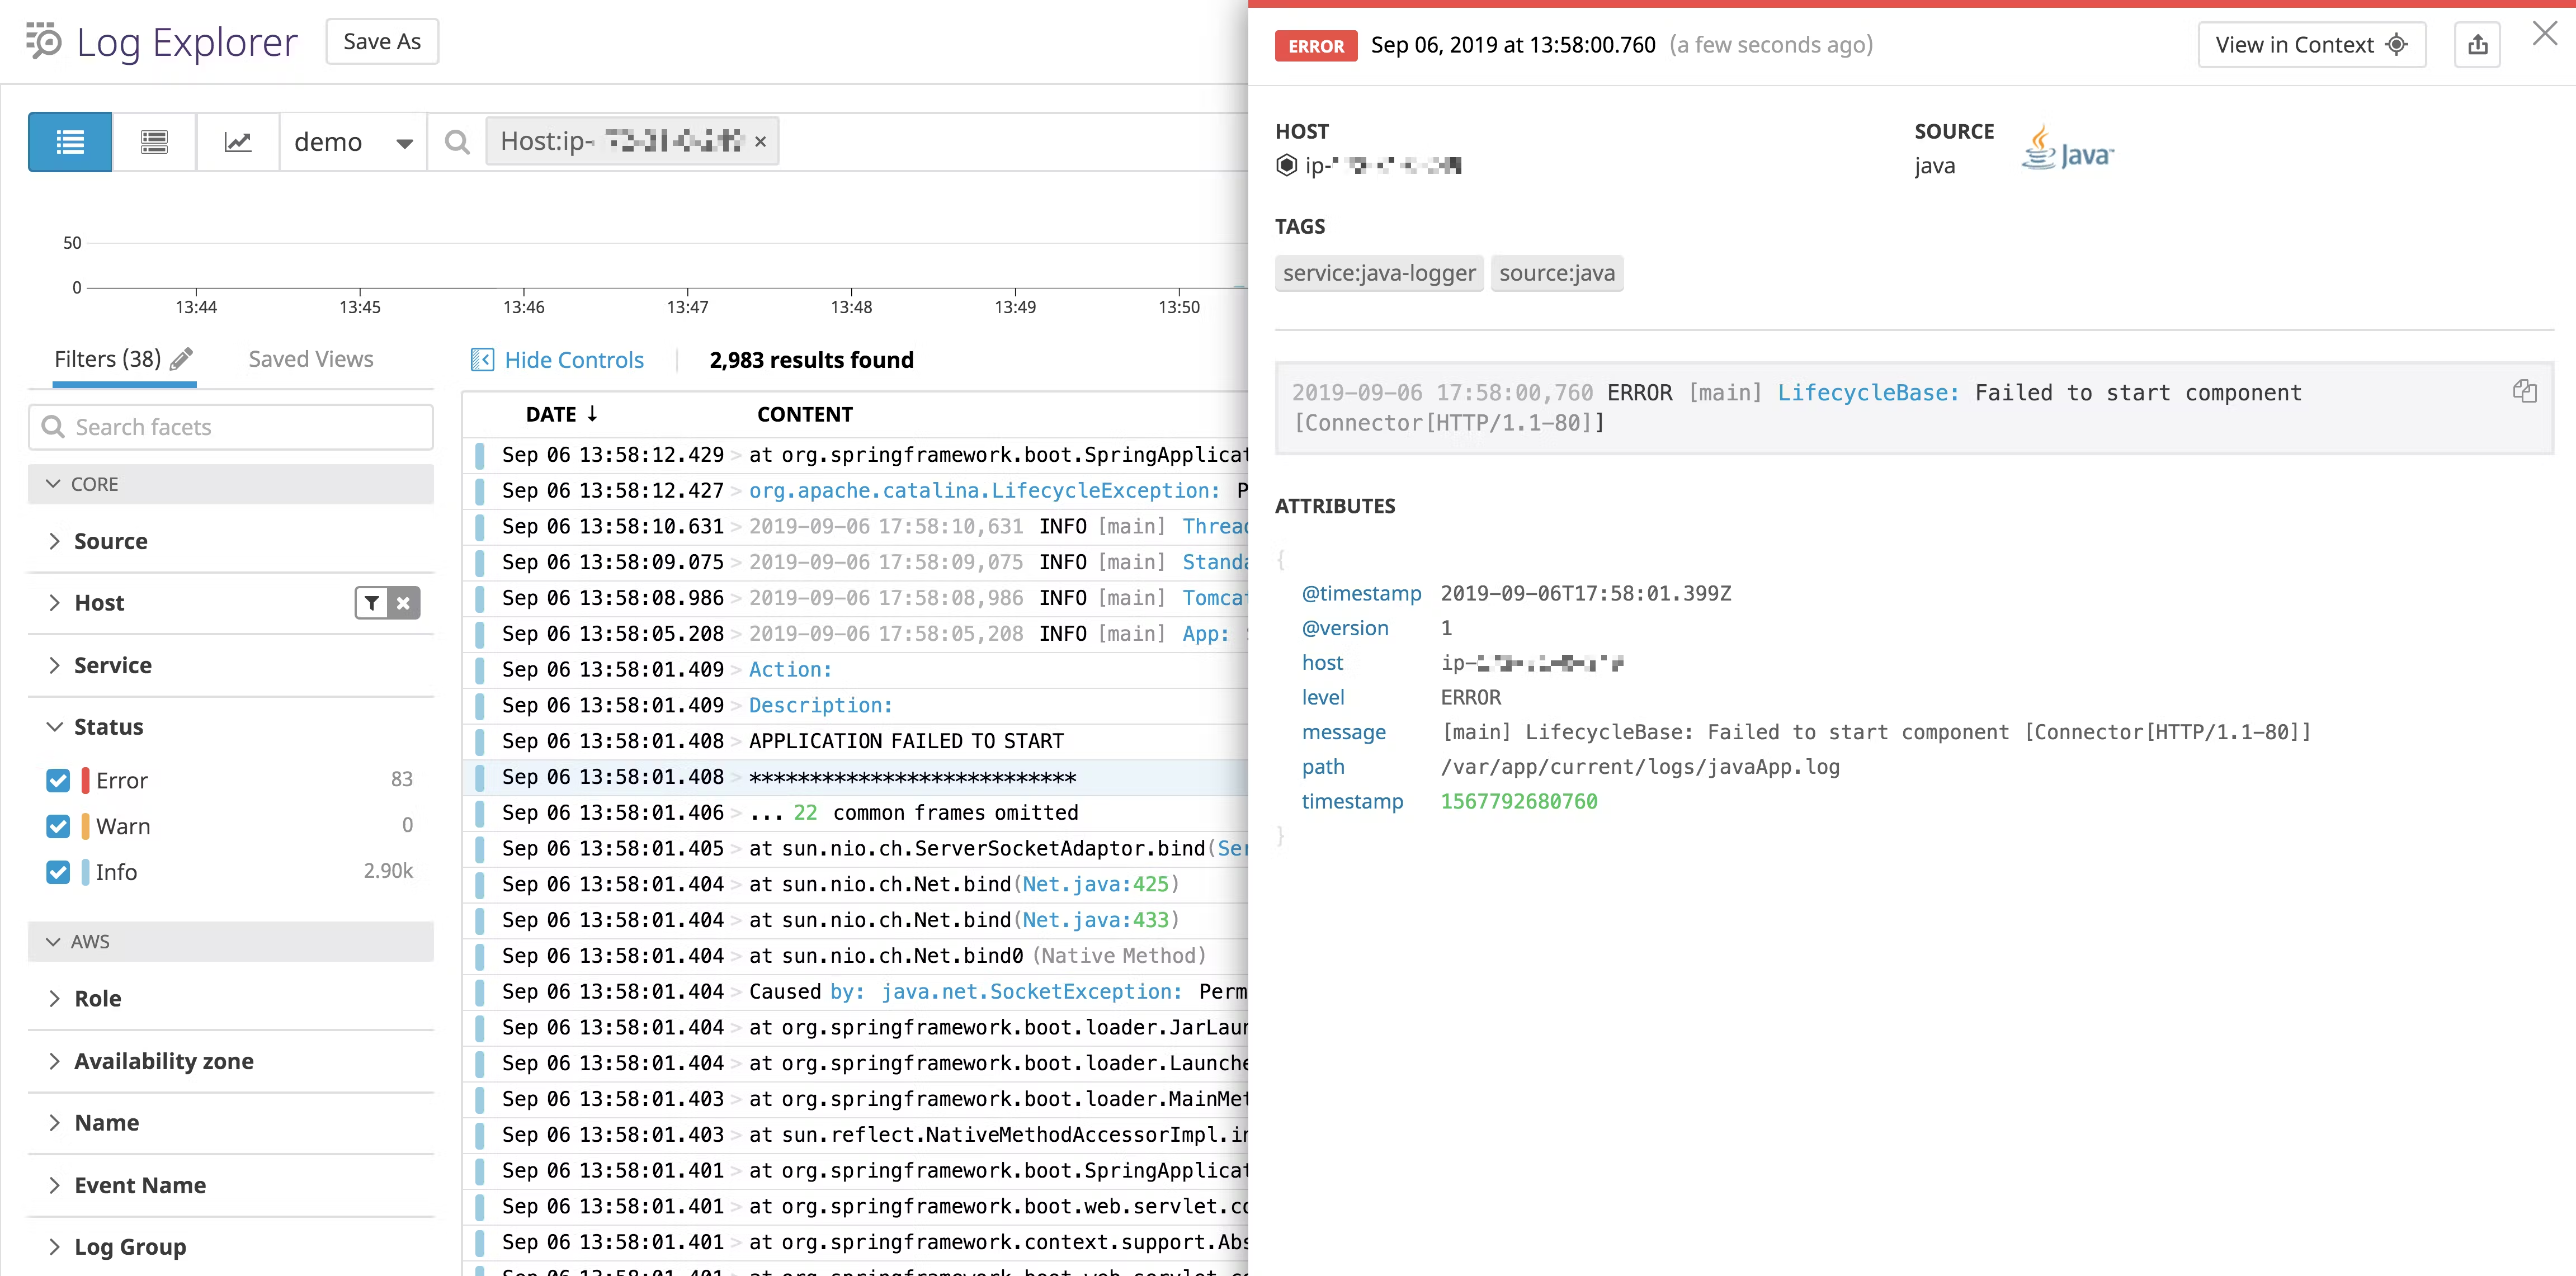
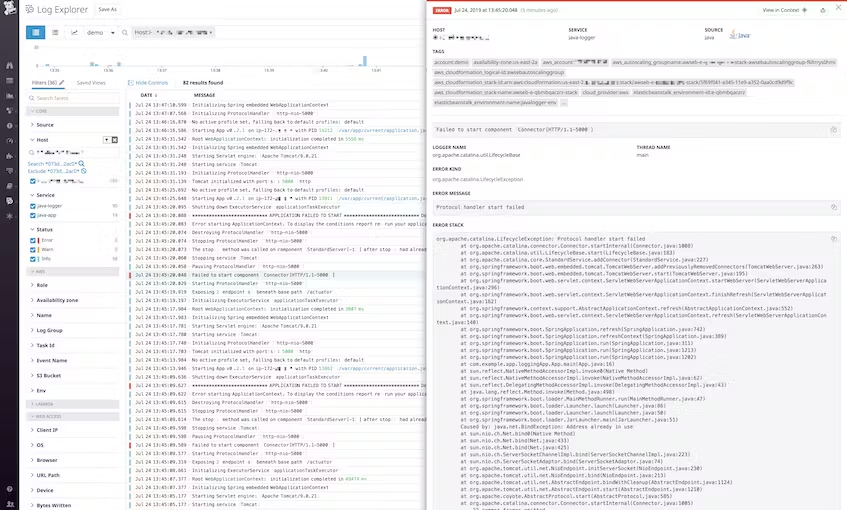
To begin, let me show you how these multi-line logs looked:

Now, here's the issue – every line in that stack trace is treated as an individual log entry. Even though it's just a single exception, it can expand into a whopping 20 lines of logs!
So, I've identified the challenge. The solution we needed to reach was to ensure that each exception doesn't break up the multiline logs in our tool.
The interesting thing was that we were using Winston for logging, and to solve this challenge, the first thing we had to do was make sure Winston logs the error stack as JSON. Essentially, we needed to convert something like this into json:
2019-08-14 14:51:22,299 ERROR [http-nio-8080-exec-8] classOne: Index out of range
java.lang.StringIndexOutOfBoundsException: String index out of range: 18
	at java.lang.String.charAt(String.java:658)
	at com.example.app.loggingApp.classOne.getResult(classOne.java:15)
	at com.example.app.loggingApp.AppController.tester(AppController.java:27)
	at sun.reflect.NativeMethodAccessorImpl.invoke0(Native Method)
	at sun.reflect.NativeMethodAccessorImpl.invoke(NativeMethodAccessorImpl.java:62)
	at sun.reflect.DelegatingMethodAccessorImpl.invoke(DelegatingMethodAccessorImpl.java:43)
	at java.lang.reflect.Method.invoke(Method.java:498)
	at org.springframework.web.method.support.InvocableHandlerMethod.doInvoke(InvocableHandlerMethod.java:190)
	at org.springframework.web.method.support.InvocableHandlerMethod.invokeForRequest(InvocableHandlerMethod.java:138)
[...]
We use winston for logging so enabling this was quite straightforward. I simply had to enable the formatting and configure it to use JSON:
const logger = winston.createLogger({
  format: winston.format.combine(
    winston.format.json(),
  ),
})
So, we've successfully tackled the first challenge. Our logs are now turns into something like
{"@timestamp":"2019-08-14T18:46:04.449+00:00","@version":"1","message":"Index out of range","logger_name":"com.example.app.loggingApp.classOne","thread_name":"http-nio-5000-exec-6","level":"ERROR","level_value":40000,"stack_trace":"java.lang.StringIndexOutOfBoundsException: String index out of range: 18\n\tat java.lang.String.charAt(String.java:658)\n\tat com.example.app.loggingApp.classOne.getResult(classOne.java:15)\n\tat com.example.app.loggingApp.AppController.tester(AppController.java:27)\n\tat sun.reflect.NativeMethodAccessorImpl.invoke0(Native Method)\n\tat sun.reflect.NativeMethodAccessorImpl.invoke(NativeMethodAccessorImpl.java:62)\n\tat sun.reflect.DelegatingMethodAccessorImpl.invoke(DelegatingMethodAccessorImpl.java:43)\n\tat java.lang.reflect.Method.invoke(Method.java:498)\n\tat org.springframework.web.method.support.InvocableHandlerMethod.doInvoke(InvocableHandlerMethod.java:190)\n\tat org.springframework.web.method.support.InvocableHandlerMethod.invokeForRequest(InvocableHandlerMethod.java:138)\n\tat
[...]
}
The second challenge arose from uncaught exceptions and unhandled rejections. The issue here was that these errors weren't being handled, and as a result, they were leaving raw error stacks, which isn't ideal.
To address this, our next step was to ensure that every part of the system where exceptions weren't being caught and where promise rejections weren't being handled would be taken care of. This is indeed a challenging task and will require a significant amount of work.
Interestingly, both of these issues can be handled using the global process events called 'uncaughtException' and 'unhandledRejection' as demonstrated below:
global.process.on(
      'uncaughtException',
      () => {},
)global.process.on(
'unhandledRejection',
() => {},
)Fortunately, Winston has built-in flags to address these issues.
const logger = winston.createLogger({
  format: winston.format.combine(winston.format.json()),
})

const options = {
  handleExceptions: true,
  handleRejections: true,
}

if (config.logging.json) {
  options.stringify = stringify
}

logger.add(new winston.transports.Console(options))

module.exports = logger
Through these two adjustments, we managed to transform our logs to look like this:

Besides those changes, there were some smaller components within the system that were contributing to this challenge. One interesting component was Sentry.
You might wonder, why bother with Sentry when all you're doing is streaming logs from your trusted logger tool to a service like Datadog? Well, here's the thing: if your sole concern is streaming logs from a tool like Winston to Datadog, you probably don't need to worry about it.
However, it's important to consider that your platform engineer might be sending Datadog logs from the entire cluster. It's no longer just about Winston; it's about Kubernetes to Datadog logging, especially in Kubernetes-related setups.
Therefore, it's crucial to review any logging implemented via Sentry.
Regarding Sentry, it essentially sends logs or error stacks to the Sentry logging system. However, for uncaught exceptions and unhandled rejections, it also logs to the console before sending them to the Sentry dashboard.
To address this, you can simply disable both by
Sentry.init({
dsn: 'MY_SENTRY_DSN',
environment: 'MY_ENV',
integrations: [
    new Sentry.Integrations.GlobalHandlers({
        onerror: false,
        onunhandledrejection: false
    })
]
});
However, disabling them in this manner would result in losing the ability to see them logged in the Sentry dashboard as well.
After spending a few minutes searching the internet, I found a solution. We created a custom integration that captures uncaught exceptions and unhandled rejections but refrains from sending them to the console. It wasn't too difficult to do. I simply went into the built-in Sentry integration. https://github.com/getsentry/sentry-javascript/blob/develop/packages/node/src/integrations/onuncaughtexception.ts
https://github.com/getsentry/sentry-javascript/blob/develop/packages/node/src/integrations/onunhandledrejection.ts And made sure that everything unnecessary was removed. With this, I ended up with the following piece of code for the custom integration:
export class OnUnhandledRejection implements Integration {
  /**
   * @inheritDoc
   */
  public static id: string = 'OnUnhandledRejection'

  /**
   * @inheritDoc
   */
  public name: string = OnUnhandledRejection.id

  /**
   * @inheritDoc
   */
  public constructor(
    private readonly _options: {
      /**
       * Option deciding what to do after capturing unhandledRejection,
       * that mimicks behavior of node's --unhandled-rejection flag.
       */
      mode: UnhandledRejectionMode
    } = { mode: 'warn' },
  ) {}

  /**
   * @inheritDoc
   */
  public setupOnce(): void {
    global.process.on(
      'unhandledRejection',
      this.sendUnhandledPromise.bind(this),
    )
  }

  /**
   * Send an exception with reason
   * @param reason string
   * @param promise promise
   */
  public sendUnhandledPromise(reason: unknown, promise: unknown): void {
    const hub = getCurrentHub()
    if (hub.getIntegration(OnUnhandledRejection)) {
      hub.withScope((scope: Scope) => {
        scope.setExtra('unhandledPromiseRejection', true)
        hub.captureException(reason, {
          originalException: promise,
          data: { mechanism: { handled: false, type: 'onunhandledrejection' } },
        })
      })
    }
  }
export class OnUncaughtException implements Integration {
/**
* @inheritDoc
*/
public static id: string = 'OnUncaughtException'
/**
* @inheritDoc
*/
public name: string = OnUncaughtException.id
/**
* @inheritDoc
*/
public constructor(private readonly _options: {} = {}) {}
/**
* @inheritDoc
*/
public setupOnce(): void {
global.process.on(
'uncaughtException',
this.sendUncaughtException.bind(this),
)
}
/**
* Send an exception with reason
* @param reason string
* @param promise promise
*/
public sendUncaughtException(reason: unknown, promise: unknown): void {
const hub = getCurrentHub()
if (hub.getIntegration(OnUncaughtException)) {
hub.withScope((scope: Scope) => {
scope.setLevel('fatal')
hub.captureException(reason, {
originalException: promise,
data: {
mechanism: { handled: false, type: 'onuncaughtexception' },
},
})
global.process.exit(1)
})
}
}
}By doing this, I was able to add the new custom integration to Sentry while disabling the built-in one.
Sentry.init({
	dsn: 'MY_SENTRY_DSN',
	environment: 'MY_ENV',
	integrations: (integrations: any) => {
          return [
            new OnUnhandledRejection(),
            new OnUncaughtException(),
            ...integrations.filter((integration: any) => {
              integration.name !== 'OnUnhandledRejection' &&
                integration.name !== 'OnUncaughtException'
            }),
          ]
   },
});
To conclude, here are the key takeaways to keep in mind:
- Logging is More Than Just Data: Logging is not just about collecting data; it's about how you collect and handle it.
- Consider Your Environment: In complex environments like Kubernetes clusters, it's essential to review all your logging sources, including console logs and tools like Sentry.
- Balancing Act: While it's important to capture and handle errors like uncaught exceptions and unhandled rejections, it's also crucial to strike a balance between logging everything and managing the volume of logs effectively.
- Custom Solutions: Sometimes, you may need to create custom integrations to tailor your logging approach to your specific needs. This can help you capture critical events without unnecessary noise.
- Handle Your Exceptions and Promises: Always make sure you handle your exceptions and promises properly.
- Choose the Right Logging Library: Personally, I prefer Winston because it internally handles uncaught exceptions and unhandled rejections.
- Use Logger Methods: Lastly, make it a practice to use logger methods. Avoid logging information using
console.log, especially when you're dealing with errors or JSON objects.
A good logging system should keep your error logs neat and tidy, avoiding those stacks of logs that look like a programmer's version of a Jenga tower gone wild. A good logging system is a valuable tool for making the job of debugging issues straightforward.
Well-formatted logs can help a lot with debugging because they show what is going on in your system in a clear and organised way.
The main point of this post is to stress that logging is more than just sending your system's actions to tools for tracking and observing. Not only what you log is important, but also how you log.